Photochemical Cycle of , , and
Perform photochemical reactions inside environmental chambers.
Explain the principle of operation of and gas-phase monitors.
Explain the photochemical cycle of , , and .
Measure and calculate the ozone produced at the photostationary state.
Background
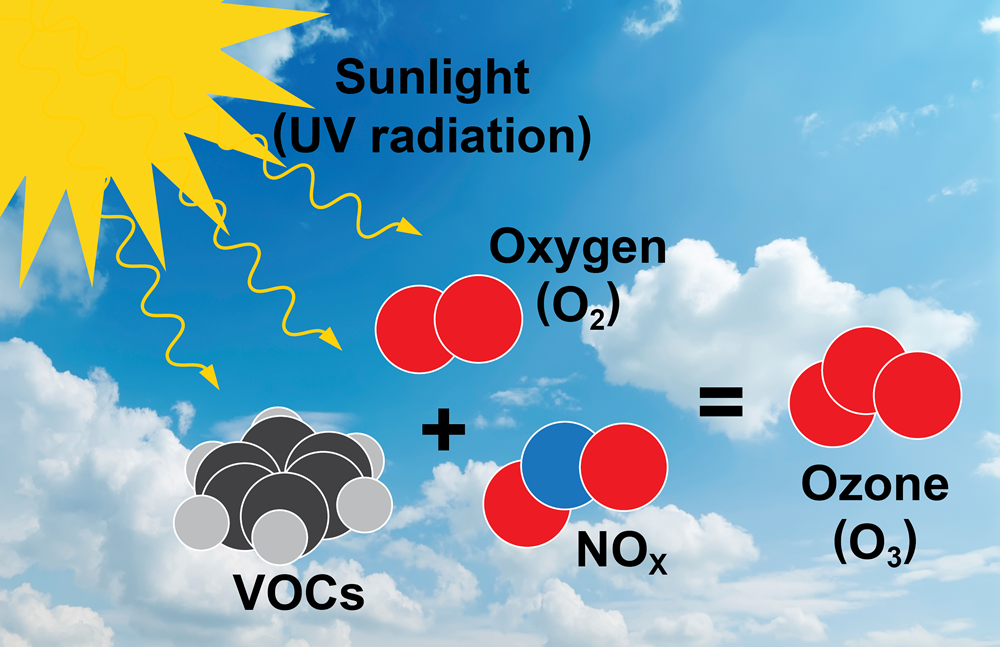
Ozone is a gas composed of three atoms of oxygen (). Ozone in the air we breathe can harm our health, especially on hot sunny days when ozone can reach unhealthy levels. People at greatest risk of harm from breathing air containing ozone include people with asthma. Elevated exposures to ozone can affect sensitive vegetation and ecosystems, including forests, parks, wildlife refuges and wilderness areas. In particular, ozone can harm sensitive vegetation during the growing season. (Source: EPA). Tropospheric is generated from to major classes of precursor molecules: volatile organic compounds (VOCs) and nitrogen oxides , which is the sum of and . Most of the direct emissions on are in the form of . Ozone levels exceeding 200 ppb are considered severe air pollution episodes. The current U.S. National Ambient Air Quality Standard for is an 8-hour average of 80 ppb. Understanding VOC chemistry is critical to explain the total ambient concentrations. Nevertheless, the photochemical cycle of , , and remains the starting point for modeling tropospheric production.
Photochemical Production from
Sunlight at wavelength < 424 nm photolizes into and atomic
The atomic reacts with oxygen to form . Reaction (2) is the only source of atmospheric .
where is a third body required to stabilize the excited product by collision. Finally reacts with to regenerate
Reactions (1)-(3) form the basic photochemical cycle. Cycling between and takes place in the troposphere on a time scale of a minute in the daytime. There is no net production of , but some is present. The steady state concentration is
The ration depends on sunlight or blacklight intensity. For full blacklight intensity in the chamber used in this lab, . The characteristic relaxation time to steady state is
where at .
Reaction Kinetics
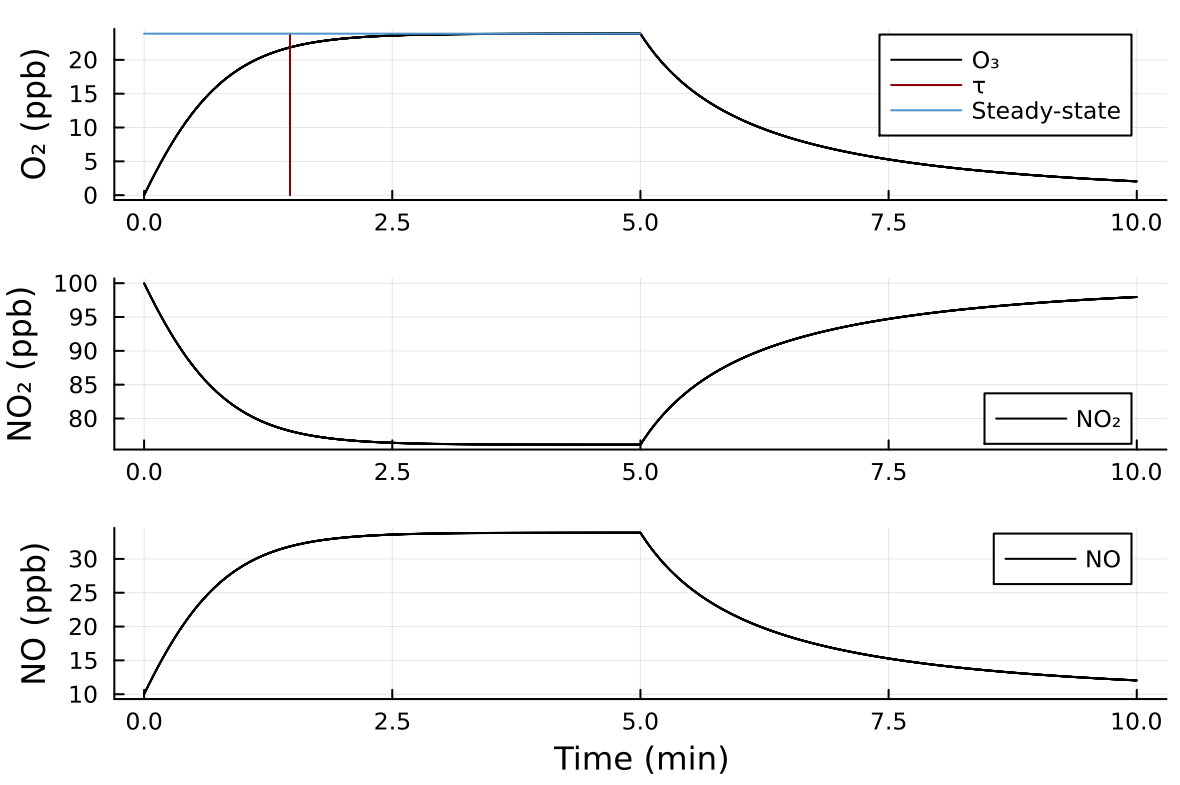
The photolysis rate depends on the actinic flux (intensity of sunlight or intensity of blacklights). At noon in the cloud-free atmosphere and otherwise lower. The value for at . The figure below shows a typical evolution of , , and for the experiment you are going to perform. At the conditions are , , and . The blacklights are turned on at . Predictions for the photostationary state concentration and relaxation time based on Eqs. (4) and (5) are provided. After 5 min, the lights are turned off and the system restores to the initial state.
The goal is to measure the photostationary steady state of the , , and system. The environmental chamber will be filled with zero air that is free of VOCs and other chemicals. A mix of and will be added to the chamber and the system will be allowed to equilibrate. Concentrations of , , and will be monitored in real time using gas-analyzers. After the system is equilibrated, blacklights will be turned on. The blacklights provide photons , thus initiating the photolysis of and the production of . Observe the formation of until the photostationary state of the system is reached. Then turn off the light and observe the reaction of with , returning the system back to the initial state. Repeat the cycle at least once, preferably twice to ensure consistent results.
During the Lab
Make sure the and gas analyzers are running. Make sure that the data acquisition system is turned on and recording data. Compare the computer logged data on the screen to the values reported on the analyzers. Fill the chamber with zero air. Verify that initial concentrations are approximately zero. Add the / mixture to the chamber. Record the initial , and concentrations. Turn on the light and let the system equilibrate to the photostationary steady state. Turn off the light and observe reversion to the initial state.
Make a draft of the schematic drawing of the experimental setup. Carefully indicate (1) All of the instruments involved, including vacuum pumps, instruments, flow rates, flow paths, light sources (location and number), compressed air sources, and data acquisition system. (2) How the reactants are added to the chamber, (3) timings of reactants added and lights turning on and off. You should make a sketch during the experiment.
Make a draft of the schematic drawing of the O3 analyzer and discuss with your group and/or TA.
Download the data from the computer for later analysis.
Report
Please follow the report outline.
Don't forget to print and paste the grading rubric at the end of your report. Not providing the grading rubric will lead to point deductions. Use the grading rubric as a checklist for how to prepare a proper report.
Methods
This lab uses an environmental chamber, a photometric UV absorption analyzer and a chemiluminescence analyzer.
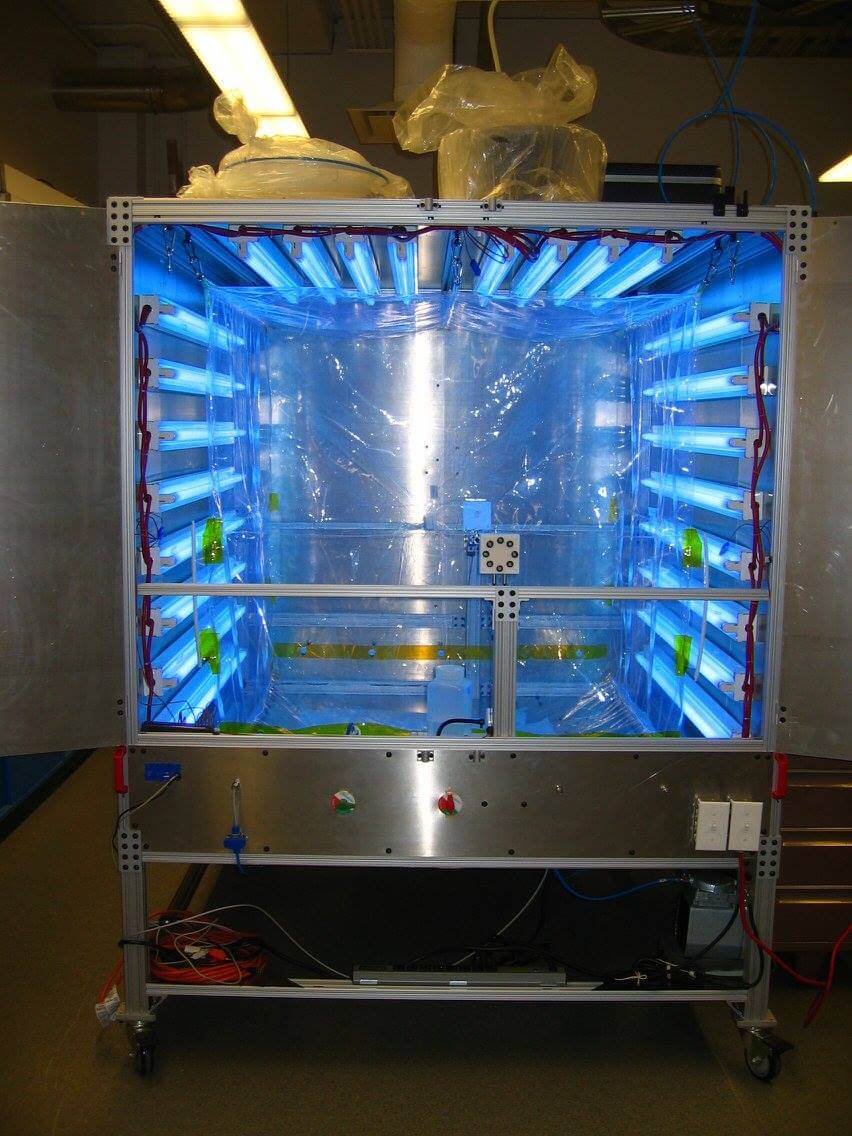
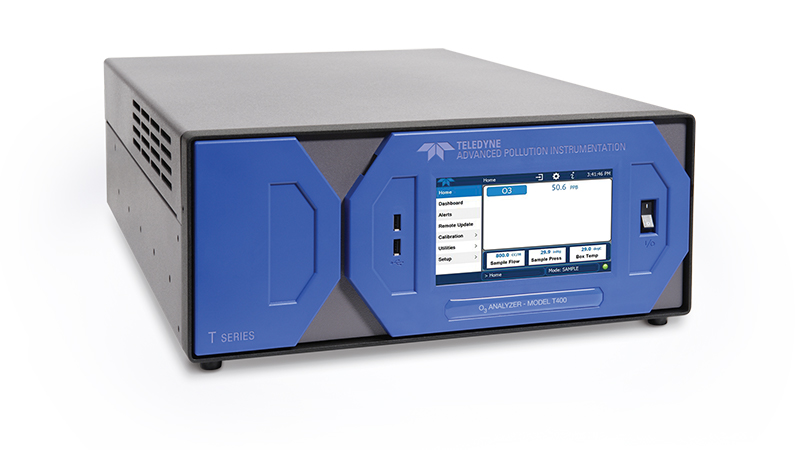
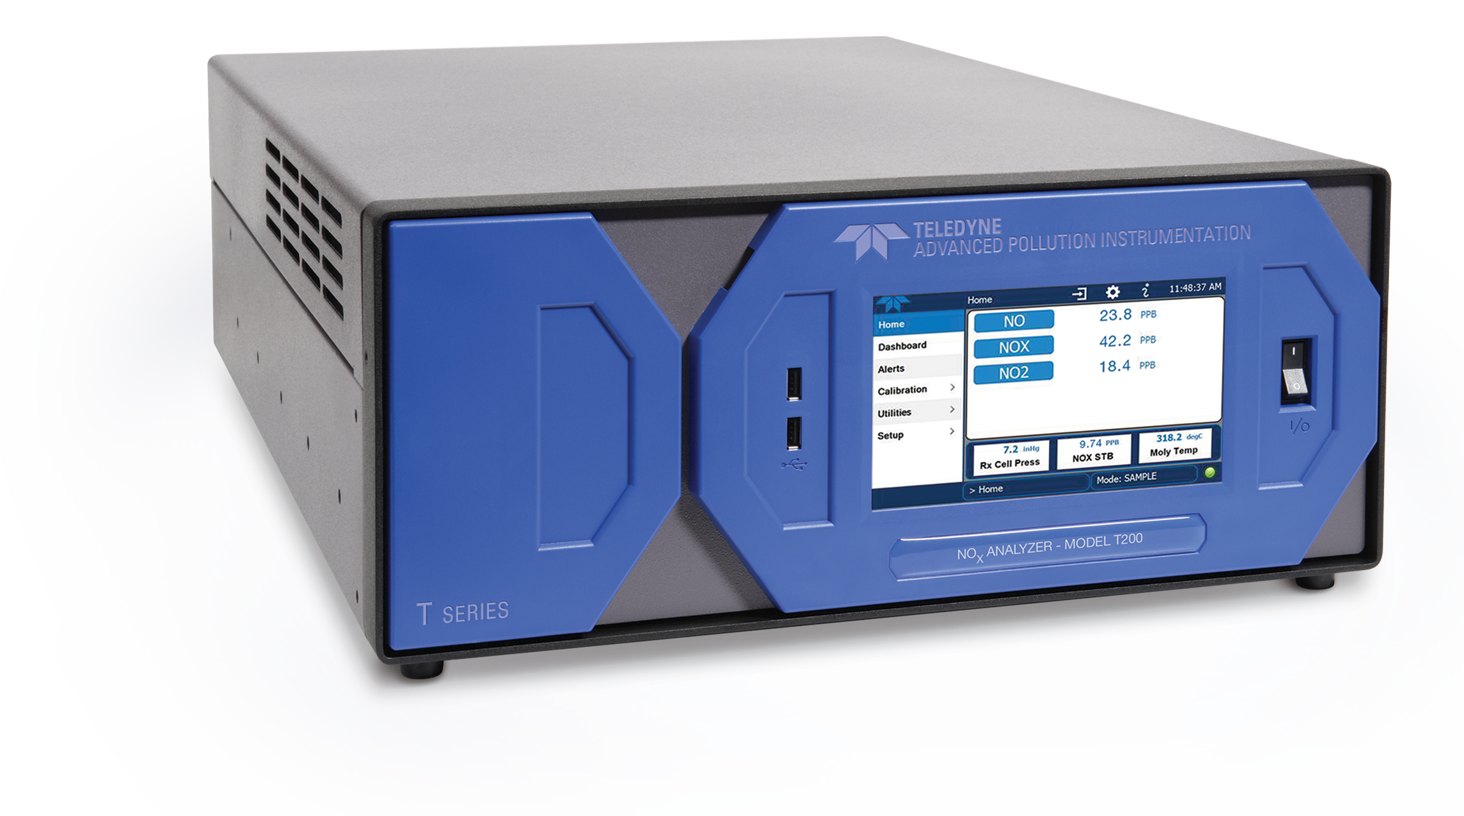
The environmental chamber consists of a Teflon bag housed inside an enclosure that is lined with blacklights. The blacklights can be turned on/off using switches. An injection port is available to add reagents. You will receive a glass bulb that contains a nominal amount of . You will add the with the help of the TA and/or the instructor. Ozone is measured using a gas-analyzer. A 254 nm UV light signal is passed through the sample cell where it is absorbed in proportion to the amount of ozone present. Periodically, a switching valve alternates measurement between the sample stream and a sample that has been scrubbed of ozone. is measured using a second gas analyzer. The instrument determines the concentration of nitric oxide (), total nitrogen oxides () , the sum of and ) and nitrogen dioxide () in a sample stream. The principle of operation is chemiluminescence. Chemiluminescence is the emission of light from a chemical reaction and is triggered by the reaction of with ozone . The amount of light produced is linear with concentration. is measured by converting with to using heated molybdenum converter chip.
Resources
Teledyne Product Manuals ( analyzer and analyzer) link