Lab 3. Aerosol Emission Factor
Explain the principle of operation for particle number measurement.
Explain the principle of operation for particle mass measurement.
Perform aerosol emission factor measurements from combustion sources.
Evaluate the emission factor on a per fuel basis in the context of the peer-reviewed literature.
Background
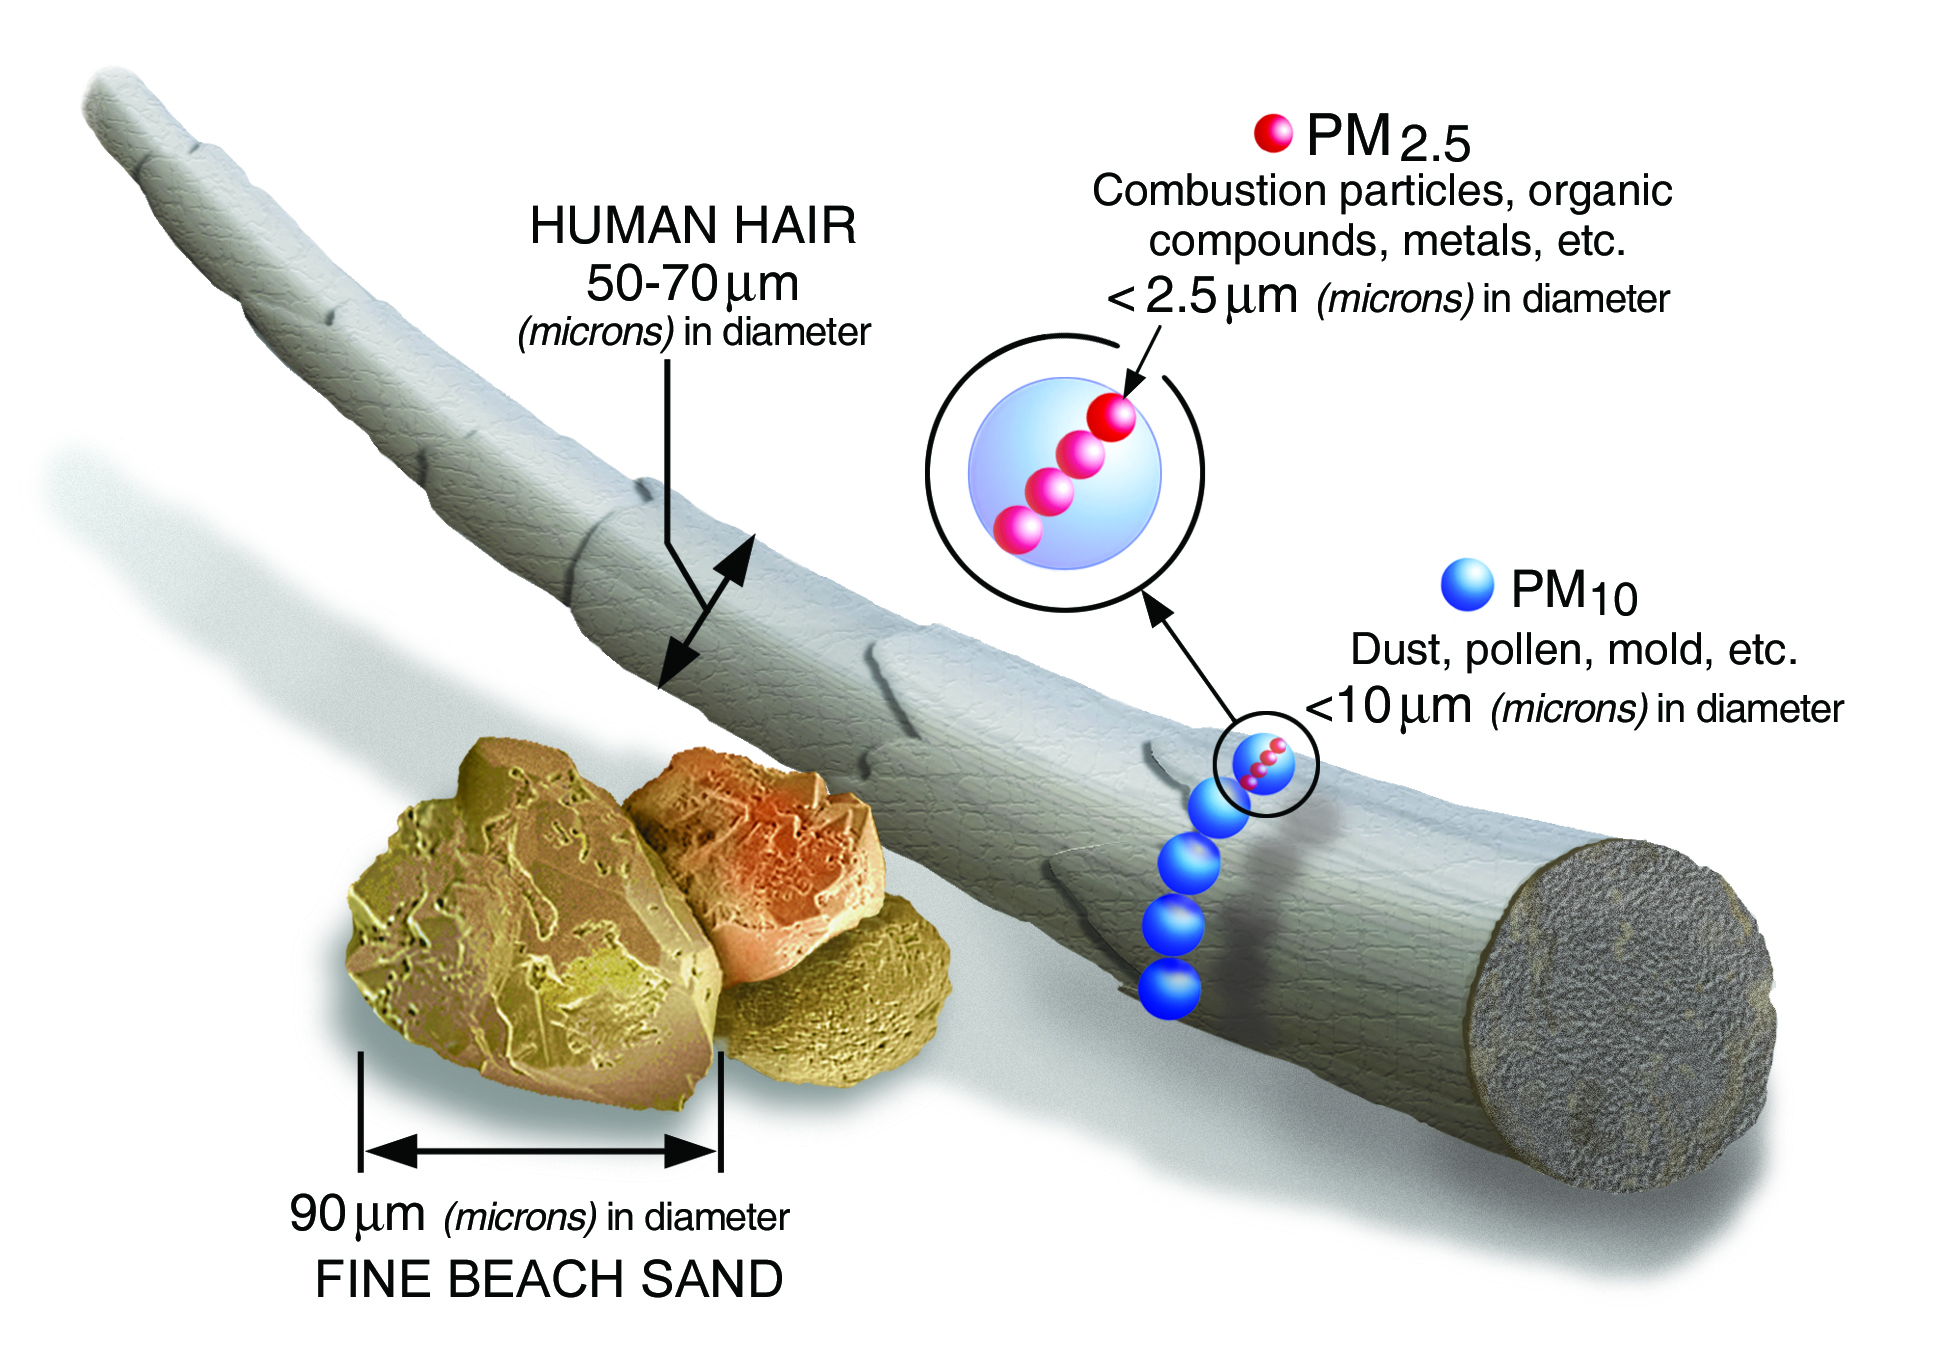
PM stands for particulate matter (also called particle pollution): the term for a mixture of solid particles and liquid droplets found in the air. Some particles, such as dust, dirt, soot, or smoke, are large or dark enough to be seen with the naked eye. Others are so small they can only be detected using an electron microscope. Particle pollution includes , which are inhalable particles, with diameters that are generally 10 micrometers and smaller and , which are fine inhalable particles, with diameters that are generally 2.5 micrometers and smaller. (Source: EPA).
Particulate matter is directly emitted in the form of smoke from combustion processes. This includes (wild)fires, residential and commercial cooking, and combustion engines. The size distribution and chemical composition of the formed particulate matter is complex and depends on the fuel and combustion process. A first estimate of the source strength of a process is the emission factor.
An emissions factor is a representative value that attempts to relate the quantity of a pollutant released to the atmosphere with an activity associated with the release of that pollutant. These factors are usually expressed as the weight of pollutant divided by a unit weight, volume, distance, or duration of the activity emitting the pollutant (e.g., kilograms of particulate emitted per megagram of coal burned). Such factors facilitate estimation of emissions from various sources of air pollution. In most cases, these factors are simply averages of all available data of acceptable quality, and are generally assumed to be representative of long-term averages for all facilities in the source category (i.e., a population average). (Source: EPA).
In the atmosphere or indoor environment, air often dilutes by mixing. Emission factors can be estimated using the simplified carbon balance method, which assumes that all carbon in the fuel is converted to . In this method the change in observed property (ozone , particle number , or particle mass ) is normalized by the change in . The increase in serves as a measure of fuel combusted and accounts for the dilution with background air. (During combustion the vast majority of carbon is converted to ). An example is shown below.
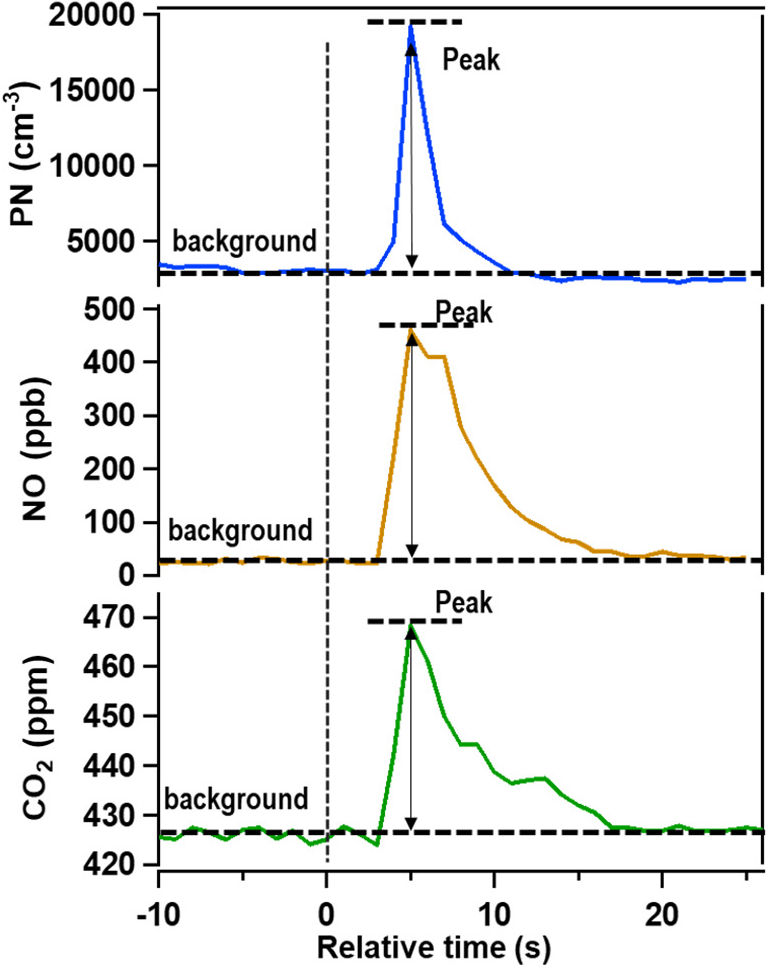
Figure (Source: Shen et al., 2022). Time series of pollutant signals. The vertical dashed line indicates the time at which a vehicle passes the sensor platform.
The figure shows a time series of particle number concentration, , and . The dashed horizontal line is the baseline concentration. In the plume, the particle number concentration increased from (baseline) to (peak plume conditions). The change is . At the same time, increased from to . The change is . The emission factor can be calculated as
Furthermore, one ppm of equals . Also of fuel will combust into . The conversion factor is fuel dependent but does not vary greatly between fuels. Accounting for this unit conversion, the particle number emission factor per kg of fuel is . The interpretation is that burning of fuel emits particles. Emission factors for or or can be obtained analogously. However, the final emission factor will take on different units, e.g. for .
Report
Please follow the report outline.
Don't forget to print and paste the grading rubric at the end of your report. Not providing the grading rubric will lead to point deductions. Use the grading rubric as a checklist for how to prepare a proper report.
Methods
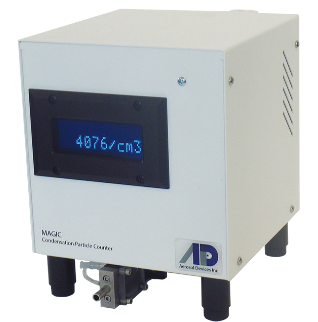
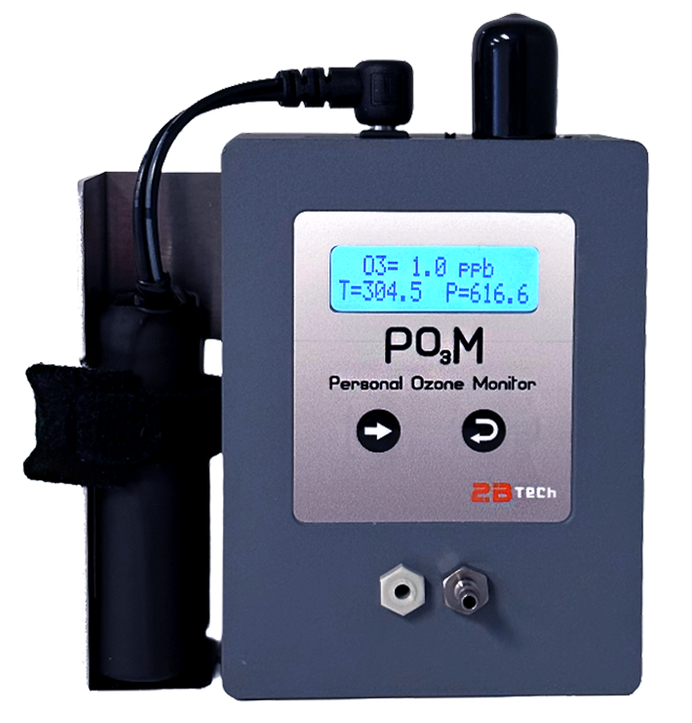
Particle counter (MAGIC), ozone sensor (POM), and sensor. The three sensors are bundled together with their batteries in an open-top tool carrying case. Check the sensor displays frequently to ensure they are recording reasonable data, e.g. not zero. Try to keep the sensors shaded and cool on sunny days; the ozone sensor in particular has been found to stop recording if it overheats. If you have questions about the sensors or your preliminary data, return to lab to ask the instructors.
The Airbeam3 sensor detects the amount of light scattered as single particles pass through a laser. In general, larger particles scatter more light than smaller ones. These sensors are sensitive enough to detect particles larger than approximately 0.3 μm. The low-resolution size distribution measured by the sensor is related to an approximate mass concentration using a built-in algorithm. The detector at the heart of these sensors is the same as that in the widely used PurpleAir sensor.
Resources
MAGIC Spec Sheet (link)
MAGIC Operating Manual (link)
POM Operating Manual (link)
Airbeam3 manual (link)
NWS Riverside Station (link)
CARB Ozone Data (link)
Tips and Tricks
At least for some students, the time included in the downloaded AirBeam data is in a format that Excel or Sheets can’t recognize. An example is 2023-10-02T13:20:02.000.
To adjust the format so that Excel can recognize it and allow you to include it in a graph, you should use the find and replace feature (there is probably a counterpart in Sheets, but I am unfamiliar with it). Simply type CTRL-f and then click on the “Replace” tab.
For the format shown above, you should first remove the .000 at the end by typing .001 next to “Find what” and nothing next to “Replace with”. Click Replace All.
Next, add “T” next to “Find what” and a space next to “Replace with”. Again click Replace All.