Aerosol Optical Depth
At the end of this lab you will be
familiar basic definitions, length scales, concentrations scales, sources and types of aerosol
able to explain the main impacts of aerosols on society including visibility, human health, climate, geoengineering, biogeochemical cycling, and deposition/acidification
able to measure optical depth using a handheld sun photometer
able to explain the principle of operation of the optical depth measurements
able to compare optical depth measurements against those taken by global networks


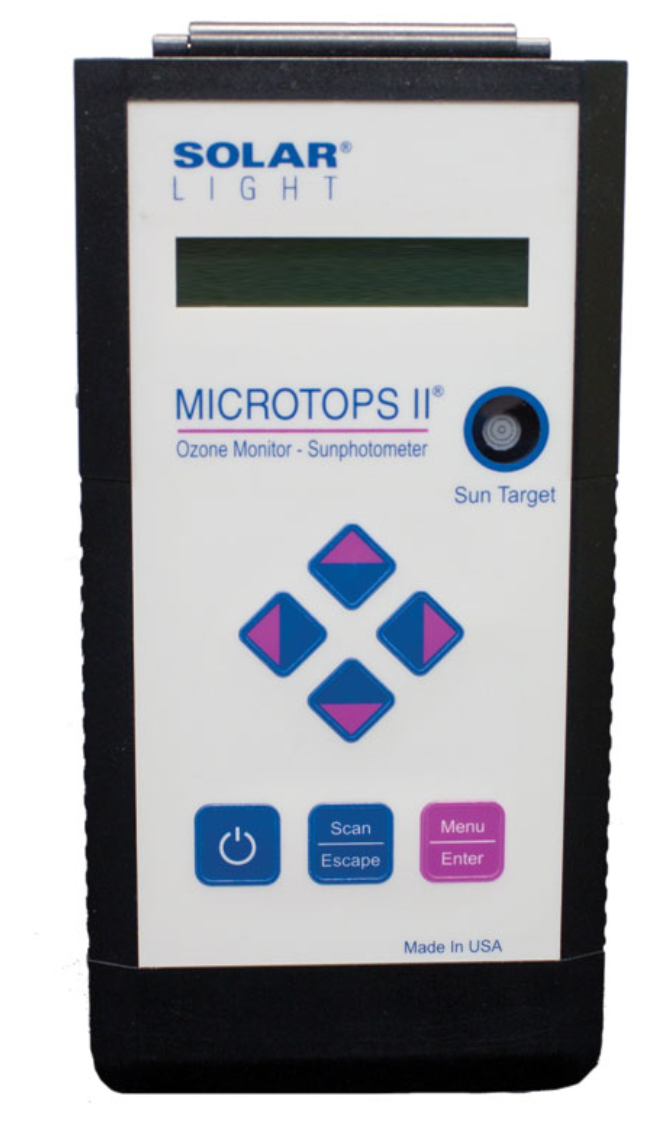
The sunphotometer remotely measures columnar “abundance” of particulate matter. It is manually pointed at the sun and measures solar intensity at a set of discrete wavelength bands. The measurements are used to calculate what is referred to as the aerosol optical depth (AOD) or aerosol optical thickness (AOT), which describes the fractional attenuation of solar radiation as it travels through the atmosphere. For an overhead sun, the fraction transmitted is , where is the optical thickness. The measurement is only possible when the sunphotometer can see the sun. It is OK if there are clouds, but not OK if they are blocking the sun. Make sure to align the times of the two measurements.
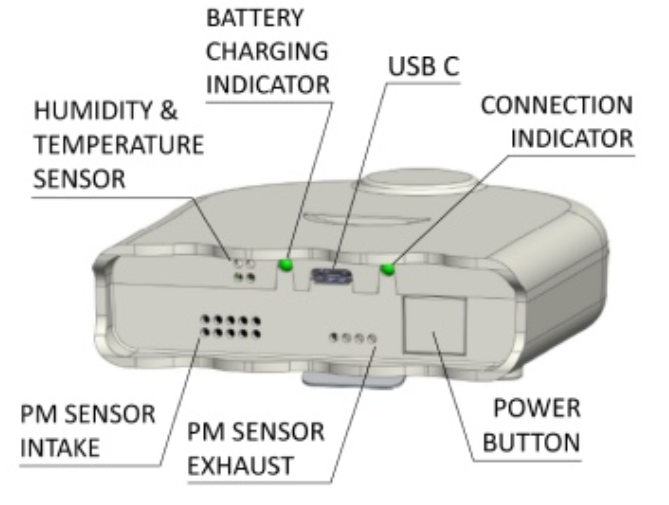
The Airbeam3 sensor detects the amount of light scattered as single particles pass through a laser. In general, larger particles scatter more light than smaller ones. These sensors are sensitive enough to detect particles larger than approximately 0.3 μm. The low-resolution size distribution measured by the sensor is related to an approximate mass concentration using a built-in algorithm. The detector at the heart of these sensors is the same as that in the widely used PurpleAir sensor.
Motivation
Satellites are a powerful tool for providing global coverage of the abundance of particulates and several key gases. Though a range of active and passive techniques are used, most provide a measure of the total abundance of the constituent of interest, e.g., ozone or particulates, through a path between the earth’s surface and the top of the atmosphere. For some applications, such a columnar abundance measurement is directly usable. But that’s not the case for understanding air quality down at the surface where we breathe. Despite numerous efforts to link what a satellite can observe with surface concentrations, there is considerable uncertainty. Even so, satellites offer the only source of information for most of the world, where dense monitoring networks like we have in Southern California don’t exist. Technological advances are also leading to increasingly powerful and accurate satellites and data products. An example is the recently launched TEMPO satellite, which provides spatially and temporally resolved concentrations of NO2 and other pollutants.
Resources
Manuals
MICROTOPS II sunphotometer manual (link)
Airbeam3 manual (link)
Auxiliary Data
Aerosol Robotic Network (AERONET) Homepage (link)
Aerosol Measurement from Space (link)
Satellite AOD Data (link)
Manuscripts
A national crowdsourced network of low-cost fine particulate matter and aerosol optical depth monitors (link)
Benefits of High Resolution PM2.5 Prediction using Satellite MAIAC AOD and Land Use Regression for Exposure Assessment (link)
Lecture Materials
Animation of length scales (link)
Introductory Lecture on aerosols
Tips and Tricks
At least for some students, the time included in the downloaded AirBeam data is in a format that Excel or Sheets can’t recognize. An example is 2023-10-02T13:20:02.000.
To adjust the format so that Excel can recognize it and allow you to include it in a graph, you should use the find and replace feature (there is probably a counterpart in Sheets, but I am unfamiliar with it). Simply type CTRL-f and then click on the “Replace” tab.
For the format shown above, you should first remove the .000 at the end by typing .001 next to “Find what” and nothing next to “Replace with”. Click Replace All.
Next, add “T” next to “Find what” and a space next to “Replace with”. Again click Replace All.