Particulate Matter Exposure
At the end of this lab you will be
familiar with regional air quality sensor networks
able to estimate particulate matter exposure
able to explain sources of personal exposure to particulate matter
able to contextualize data within regional particulate matter measurements

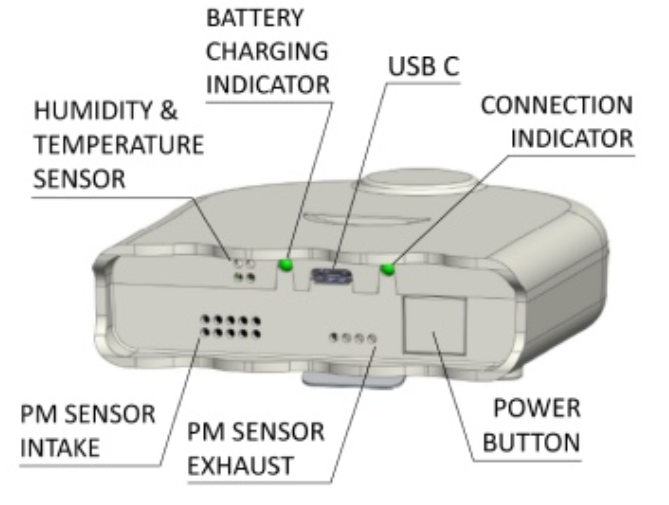
The Airbeam3 sensor detects the amount of light scattered as single particles pass through a laser. In general, larger particles scatter more light than smaller ones. These sensors are sensitive enough to detect particles larger than approximately 0.3 μm. The low-resolution size distribution measured by the sensor is related to an approximate mass concentration using a built-in algorithm. The detector at the heart of these sensors is the same as that in the widely used PurpleAir sensor.
Motivation
Connecting air pollutant concentrations to health impacts is complicated by variability in the actual exposure of individuals in an area or a study. What is typically used in an epidemiological study is the average outdoor pollutant concentration measured at a fixed monitoring site and the health outcomes of the people that live nearby. Differences in time spent in different indoor environments, the workplace, and in traffic, as well as variability in outdoor concentrations where individuals work and otherwise spend their time are all important, but not readily known. One approach used to assess average exposure is to have representative groups of people carry lightweight portable or wearable sensors over periods of several days.
Resources
Manuals
Airbeam3 manual (link)
Auxiliary Data
Regional wind data (link)
Historical meteorological data (link)
Purple air map (link)
CARB data 1 (link)
CARB data 2 (link)
CARB emissions data (link)
CARB pollution map (link)
SCAQMD community data (link)
MATES map (link)
Tips and Tricks
At least for some students, the time included in the downloaded AirBeam data is in a format that Excel or Sheets can’t recognize. An example is 2023-10-02T13:20:02.000.
To adjust the format so that Excel can recognize it and allow you to include it in a graph, you should use the find and replace feature (there is probably a counterpart in Sheets, but I am unfamiliar with it). Simply type CTRL-f and then click on the “Replace” tab.
For the format shown above, you should first remove the .000 at the end by typing .001 next to “Find what” and nothing next to “Replace with”. Click Replace All.
Next, add “T” next to “Find what” and a space next to “Replace with”. Again click Replace All.